Books
 |
Data Visualisation: A Handbook for Data Driven Design This handbook provides guidance on producing successful data visualizations. The book, written by data visualization specialist Andy Kirk, features case studies, exercises, illustrations, and examples of good and bad practices in designing visualizations. |
|
 |
Statistics Done Wrong: The Woefully Complete Guide Author Alex Reinhart details common errors and mistakes researchers make in conducting statistical analysis and offers guidance on steps to take to avoid such errors. Topics covered include experiment design and choosing appropriate statistical analysis tools; understanding p-values, significance, confidence intervals, and regression; and analytical software to help with data analysis. |
|
 |
Computer-Assisted Reporting: A Practical Guide This textbook covers how to use computer-based resources such as the internet, analytical software, and databases to find and analyze data for news reporting. Brant Houston, associate professor at the University of Missouri School of Journalism and executive director of Investigative Reporters and Editors, Inc. and the National Institute of Computer-Assisted Reporting, is the author. |
|
 |
Data Journalism This textbook, edited by John Mair and Richard Lance Keeble, gives an overview of data journalism and its impact on news reporting. Chapters focus on developing data journalism skills, creating data visualizations, and the growth of sensor journalism, as well as case studies on data journalism projects that aim to hold government and business leaders accountable. |
|
 |
Data Journalism (TCIJ) Published by The Centre for Investigative Journalism, this handbook provides an overview and tips on data journalism tools and practices, such as using Excel and spreadsheets, data scraping, and producing data visualizations. |
|
 |
Data Literacy: A User′s Guide “Data Literacy” introduces readers to data exploration and research and covers different types of big data sources as well as guidance on uncovering, cleaning, analyzing, and visualizing data. |
|
 |
Data Visualization: Principles and Practice, 2nd edition Written by Alexandru C. Telea, this textbook explores techniques and practices for creating effective data visualizations, including data representation, information visualization, image processing, and visualization of scalar, vector, and volumetric data. The second edition also covers visualization algorithms and software systems. |
|
 |
Design for Information: An Introduction to the Histories, Theories, and Best Practices Behind Effective Information Visualizations This textbook presents case studies and examples for data visualization projects and provides design principles and analytical tools for crafting visualizations. Isabel Meirelles, associate professor of graphic design at Northeastern University, is the author. |
|
 |
Facts are Sacred: The power of data The Guardian produced this digital guidebook on principles of data journalism and data visualization, incorporating examples and insights from the news organization’s award-winning data blog. The iPad edition includes the text from the hardback book along with videos, tutorials, and other interactive elements. |
|
 |
Finding Stories in Spreadsheets This text offers guidance on using data extracted from Excel and Google Spreadsheets generate story ideas and find answers to complex questions. It also features instructions on cleaning and modifying data for charts, graphs, and other illustrations using on real-word data journalism examples. |
|
 |
DATA + DESIGN: A simple introduction to preparing and visualizing information This free e-book, produced by Invoactive, explains key concepts for designing data visualizations and understanding how to present data. It is divided into sections on data fundamentals; common visualization mistakes; and collecting, preparing, and visualizing data. |
|
 |
Information is Beautiful Written by award-winning journalist David McCandless, this book is a compilation of data visualization examples to introduce readers to different ideas for presenting data in charts, graphs, and illustrations. |
|
 |
Knowledge Is Beautiful: Impossible Ideas, Invisible Patterns, Hidden Connections—Visualized In this follow up to “Information is Beautiful,” award-winning journalist David McCandless offers data visualization examples and presents cases studies that reveal the data, information, and design aspects considered during the creation of the visualizations. |
|
 |
Interactive Journalism: Hackers, Data, and Code This text traces the history of data journalism and interactive reporting and examines how the growth of this genre of reporting has impacted the journalism industry and the future of news delivery. Nikki Usher, assistant professor at the George Washington University’s School of Media and Public Affairs, is the author. |
|
 |
Journalism in an Era of Big Data: Cases, concepts, and critiques This textbook examines the growth of digital journalism and the use of big data in reporting. It also analyzes how data journalism practices may shape reporting norms, routines, and ethics and change the roles news organizations and journalists s erve in society. |
|
 |
LONDON: The Information Capital: 100 maps and graphics that will change how you view the city This coffee table book features maps and graphics that utilize public data to illustrate historical and present-day demographic and social trends in London. |
|
 |
Scraping for Journalists (2nd edition) This handbook introduces journalists to web-based tools and programming techniques for scraping data from webpages and documents. Chapters cover scraping functions in web-based tools like Google Drive, Outwit, and Open Refine, as well as basic coding to extract data. |
|
 |
Storytelling with Data: A Data Visualization Guide for Business Professionals Recognizing the importance of compelling storytelling in data journalism, this textbook focuses on how to use data visualizations to effectively convey information. Topics covered include considering the audience and context of the data, selecting the most appropriate format to display certain types of data, and design and layout considerations. |
|
 |
The Art of Access: Strategies for Acquiring Public Records Journalists David Cuillier and Charles Davis outline strategies for finding and obtaining public records through FOIA requests. The book includes advice on crafting effective public information requests and overcoming roadblocks from public officials, as well as an overview of FOIA and privacy laws. |
|
 |
Now You See It: Simple Visualization Techniques for Quantitative Analysis This textbook explores how to use data visualizations to uncover trends, patterns, and relationships in quantitative datasets. It provides tips for making graphics and illustrations using statistical software programs like Excel. |
|
 |
The Data Journalist: Getting the Story This handbook serves as a primer on incorporating big data into reporting and covers data analysis and visualization tools like Google Fusion Tables and ArcMap. The book is also accompanied by online tutorials that show readers how to apply the techniques outlined in the text. |
|
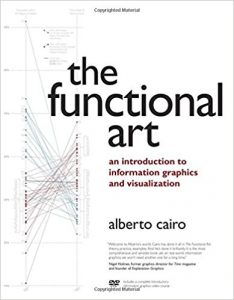 |
The Functional Art: An introduction to information graphics and visualization (Voices That Matter) Albert Cairo, Knight Chair in Visual Journalism at the University of Miami’s School of Communication, examines the artistic design aspect of crafting effective data visualizations and explores techniques for making visually engaging graphics. The book also includes best practices from graphic designers and visual journalists, as well as a 90-minute DVD-ROM with video tutorials and visualization examples. |
|
 |
The Truthful Art: Data, Charts, and Maps for Communication The sequel to Albert Cairo’s “The Functional Art,” this book gives readers instructions on using and analyzing data and provides guidance on creating data visualizations for effective storytelling. |
|
 |
Visual Miscellaneum: The Bestselling Classic, Revised and Updated: A Colorful Guide to the World’s Most Consequential Trivia This collection of infographics by award-winning journalist David McCandless showcases visualizations of data on cultural trends, health findings, technology, and war statistics. |
|
 |
Data Journalism Handbook This free online guide is a primer on data journalism, including its history and impact on reporting. The handbook also includes examples of data journalism, tips for gathering and analyzing data, and resources for creating data visualizations. |
|
 |
Data at Work: Best practices for creating effective charts and information graphics in Microsoft Excel (Voices That Matter) “Data at Work” provides guidance on using Excel to organize, extract, and clean data in spreadsheets, then using the transformed data to create charts, graphs, and other visualizations. |
|
 |
Effective Data Visualization: The Right Chart for the Right Data This book covers principles for making effective charts and data visualizations, including how to decide what format to use and what data to highlight. Each chapter includes exercises that help readers learn how to produce visualizations in Excel, along with additional resources for making charts and graphs. |
|
 |
Show Me the Numbers: Designing Tables and Graphs to Enlighten This textbook focuses on how to design tables and graphs that effectively convey key data points and trends. The book includes an overview of simple statistics for quantitative research, a guide on when to use a table or graph, and tips on how to select and present data in visualizations. |
|
 |
Designing Information: Human Factors and Common Sense in Information Design “Designing Information” examines creative and practical design considerations for crafting data visualizations and offers guidance on presenting complex data in clear, organized, and accessible formats. |
|
 |
Creating More Effective Graphs This handbook explores how to effectively use graphs and charts to illustrate data. It outlines the benefits and limitations of different types of charts and graphs and also features tips for displaying different variables and types of data. |
|
 |
The Visual Display of Quantitative Information This textbook covers the history and theory of data journalism, examining principles for analyzing data and clearly presenting findings in charts, graphics, and tables. The book also includes examples of both successful and ineffective data visualizations and advice on editing and improving graphics. |
|
 |
The Wall Street Journal Guide to Information Graphics: The Dos and Don’ts of Presenting Data, Facts, and Figures Former Wall Street Journal graphics director Dona M. Wong outlines do’s and don’ts for creating infographics and data visualizations. Topics covered include choosing what type of chart to use with your data, effectively using color in graphics, and how to chart fluctuating financial and economic trends. |
|
 |
Visualize This: The FlowingData Guide to Design, Visualization, and Statistics This book, written by FlowingData.com founder Nathan Yau, includes step-by-step tutorials for producing data visualizations, emphasizing the importance of storytelling in data journalism. It features design tips for graphs, maps, and illustrations and provides an overview of software for web- and print-based graphics. |